So in this Chapter, we will discuss the topics related to AWS ***
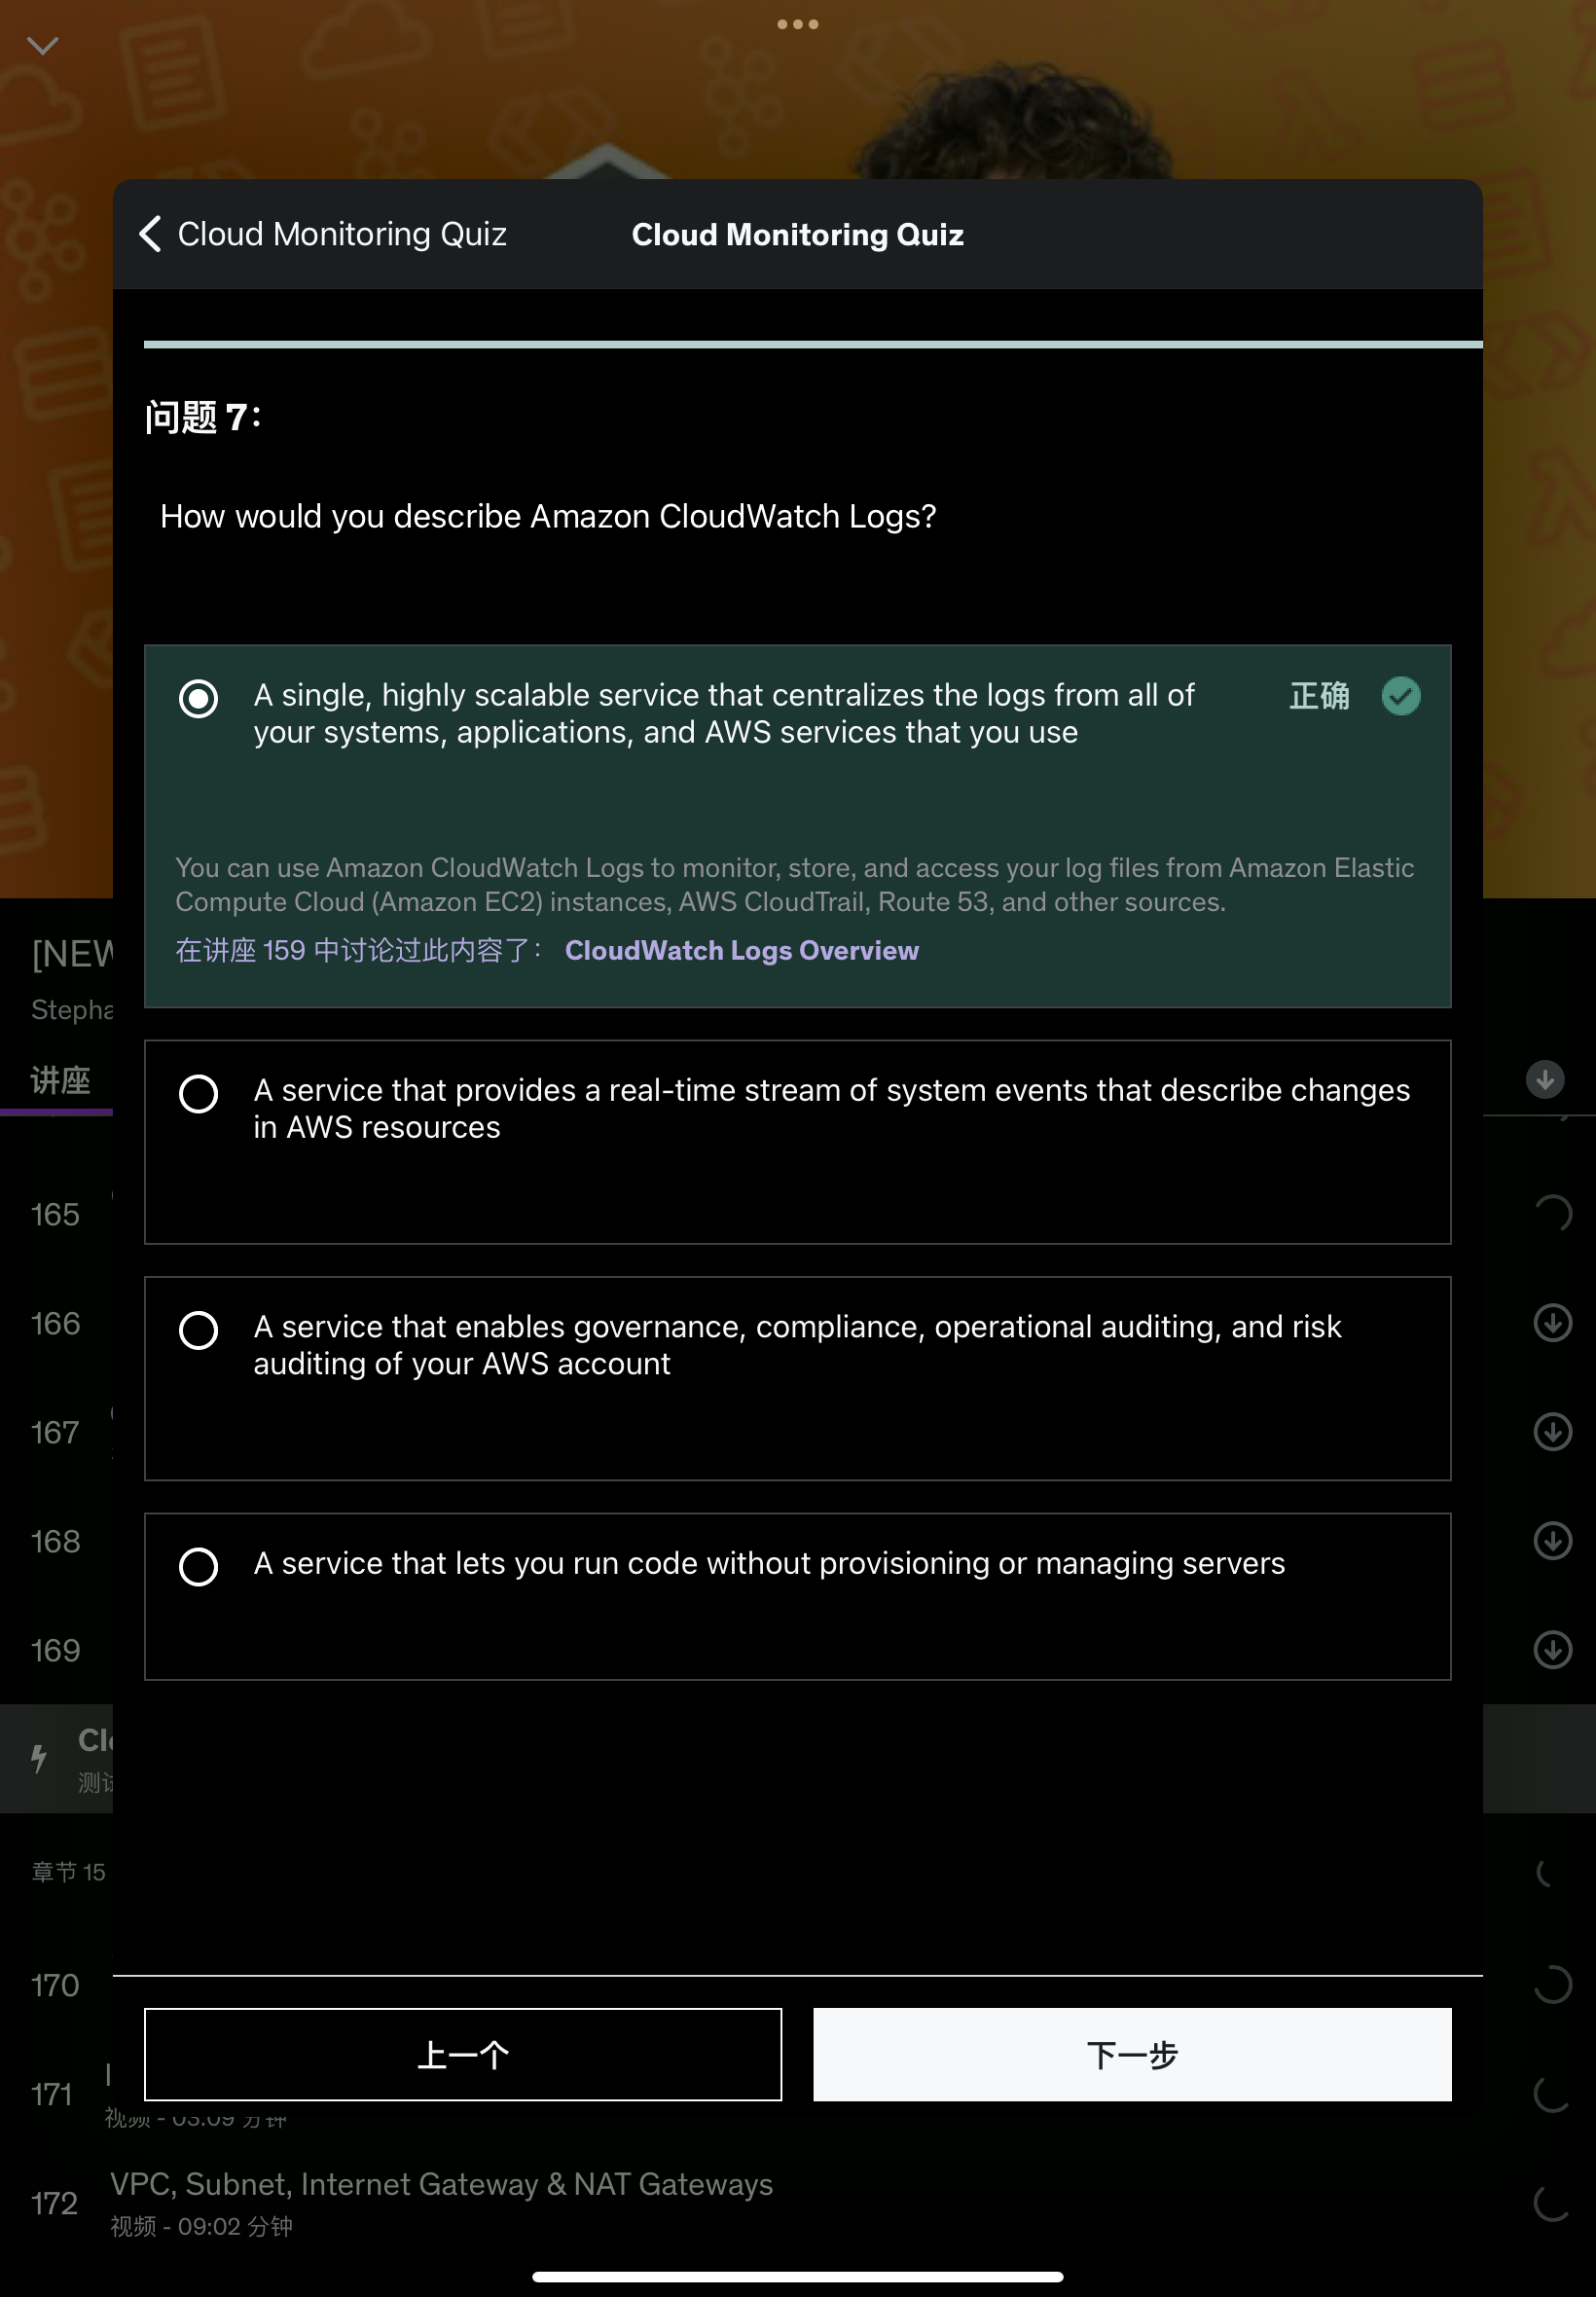
CloudTrail
Overview
AWS CloudTrail
- Provides governance, compliance and audit for your AWS account
- CloudTrail is enabled by default
- Get a history of events / API calls made within your AWS account by:
- Console
- SDK
- CLI
- Any AWS Services
- Can put logs from CloudTrail into CloudWatch Logs or S3
- A trail can be applied to ALL regions(default) or a single region
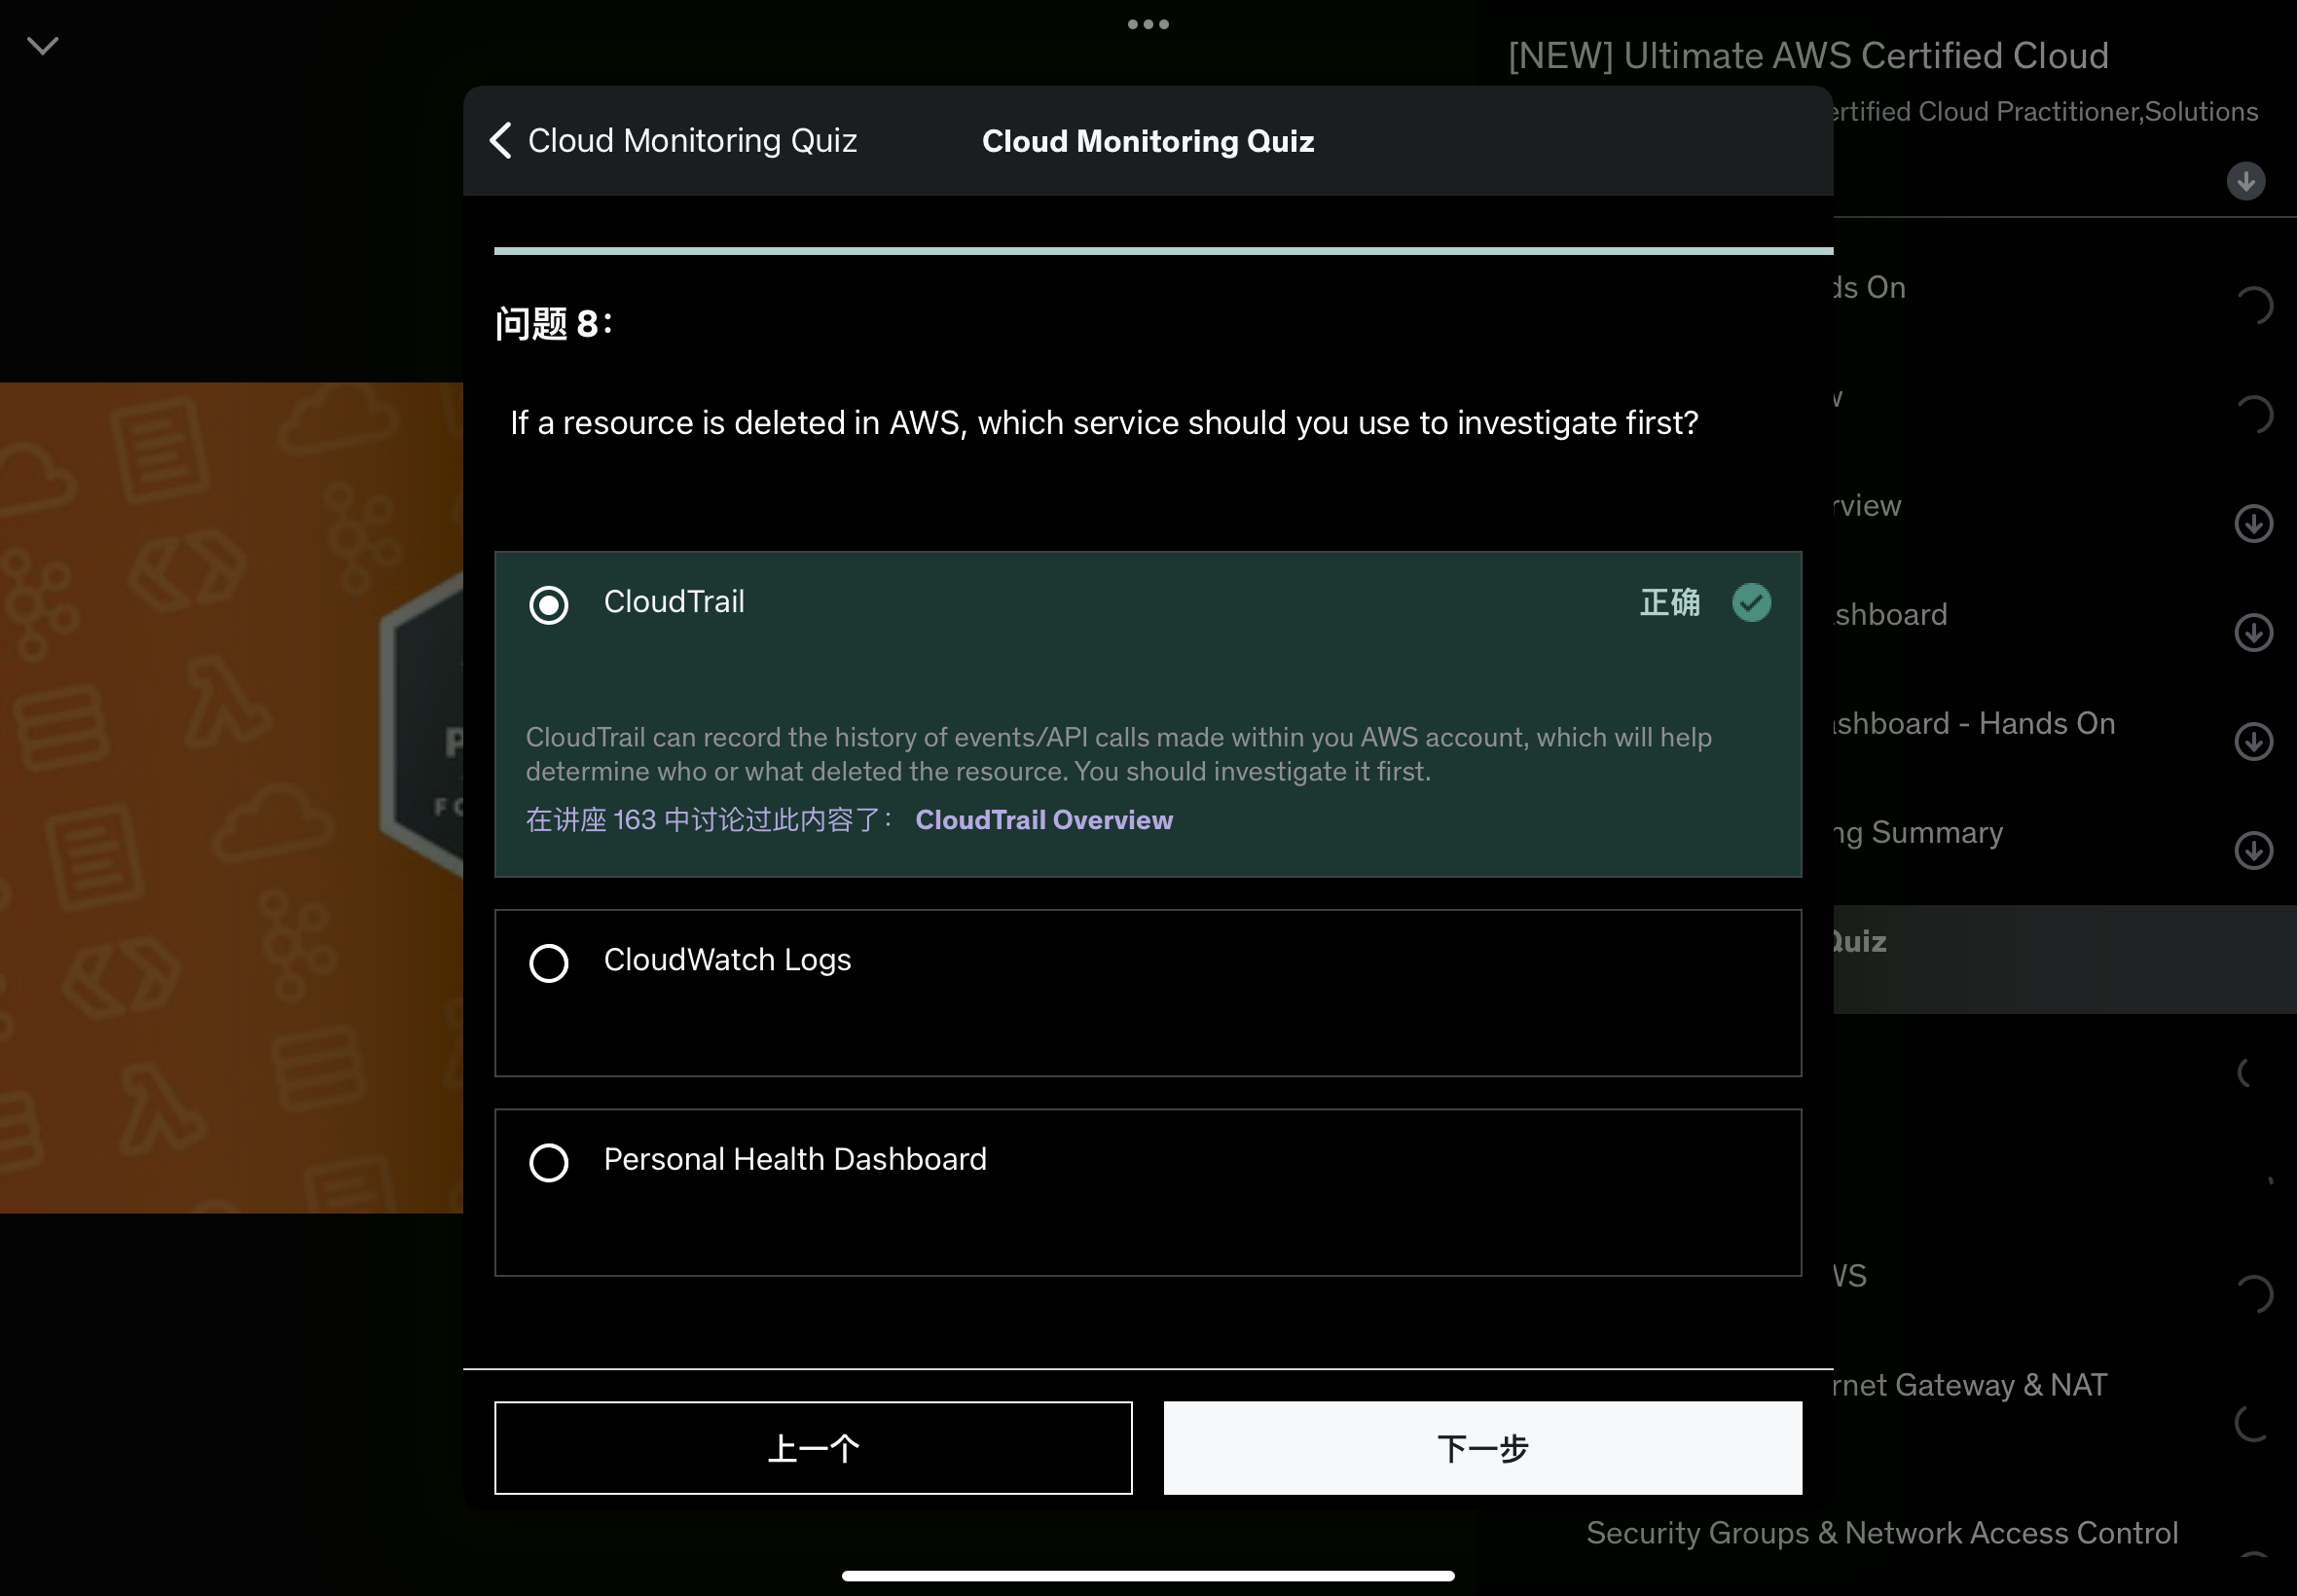
- If a resource is deleted from AWS, investigate CloudTrail first.
If a resource is deleted from AWS, then how would you know what is deleted, who deleted it and when. Then the answer will is going to be CloudTrail.
So anytime an API call needs to be investigated, CloudTrail is going to be the answer.
So to summarize, from within the CloudTrail console, we can have information about the usage of the SDK, CLI and Console, as well as any IAM users and IAM roles and all the API calls they make.Then the CloudTail Console will display it.
But if you want long term of data what you can do is send them to CloudWatch Logs or S3 buckets for longer term retention.
And from within CloudTrail, you can do any type of inspection and audit. 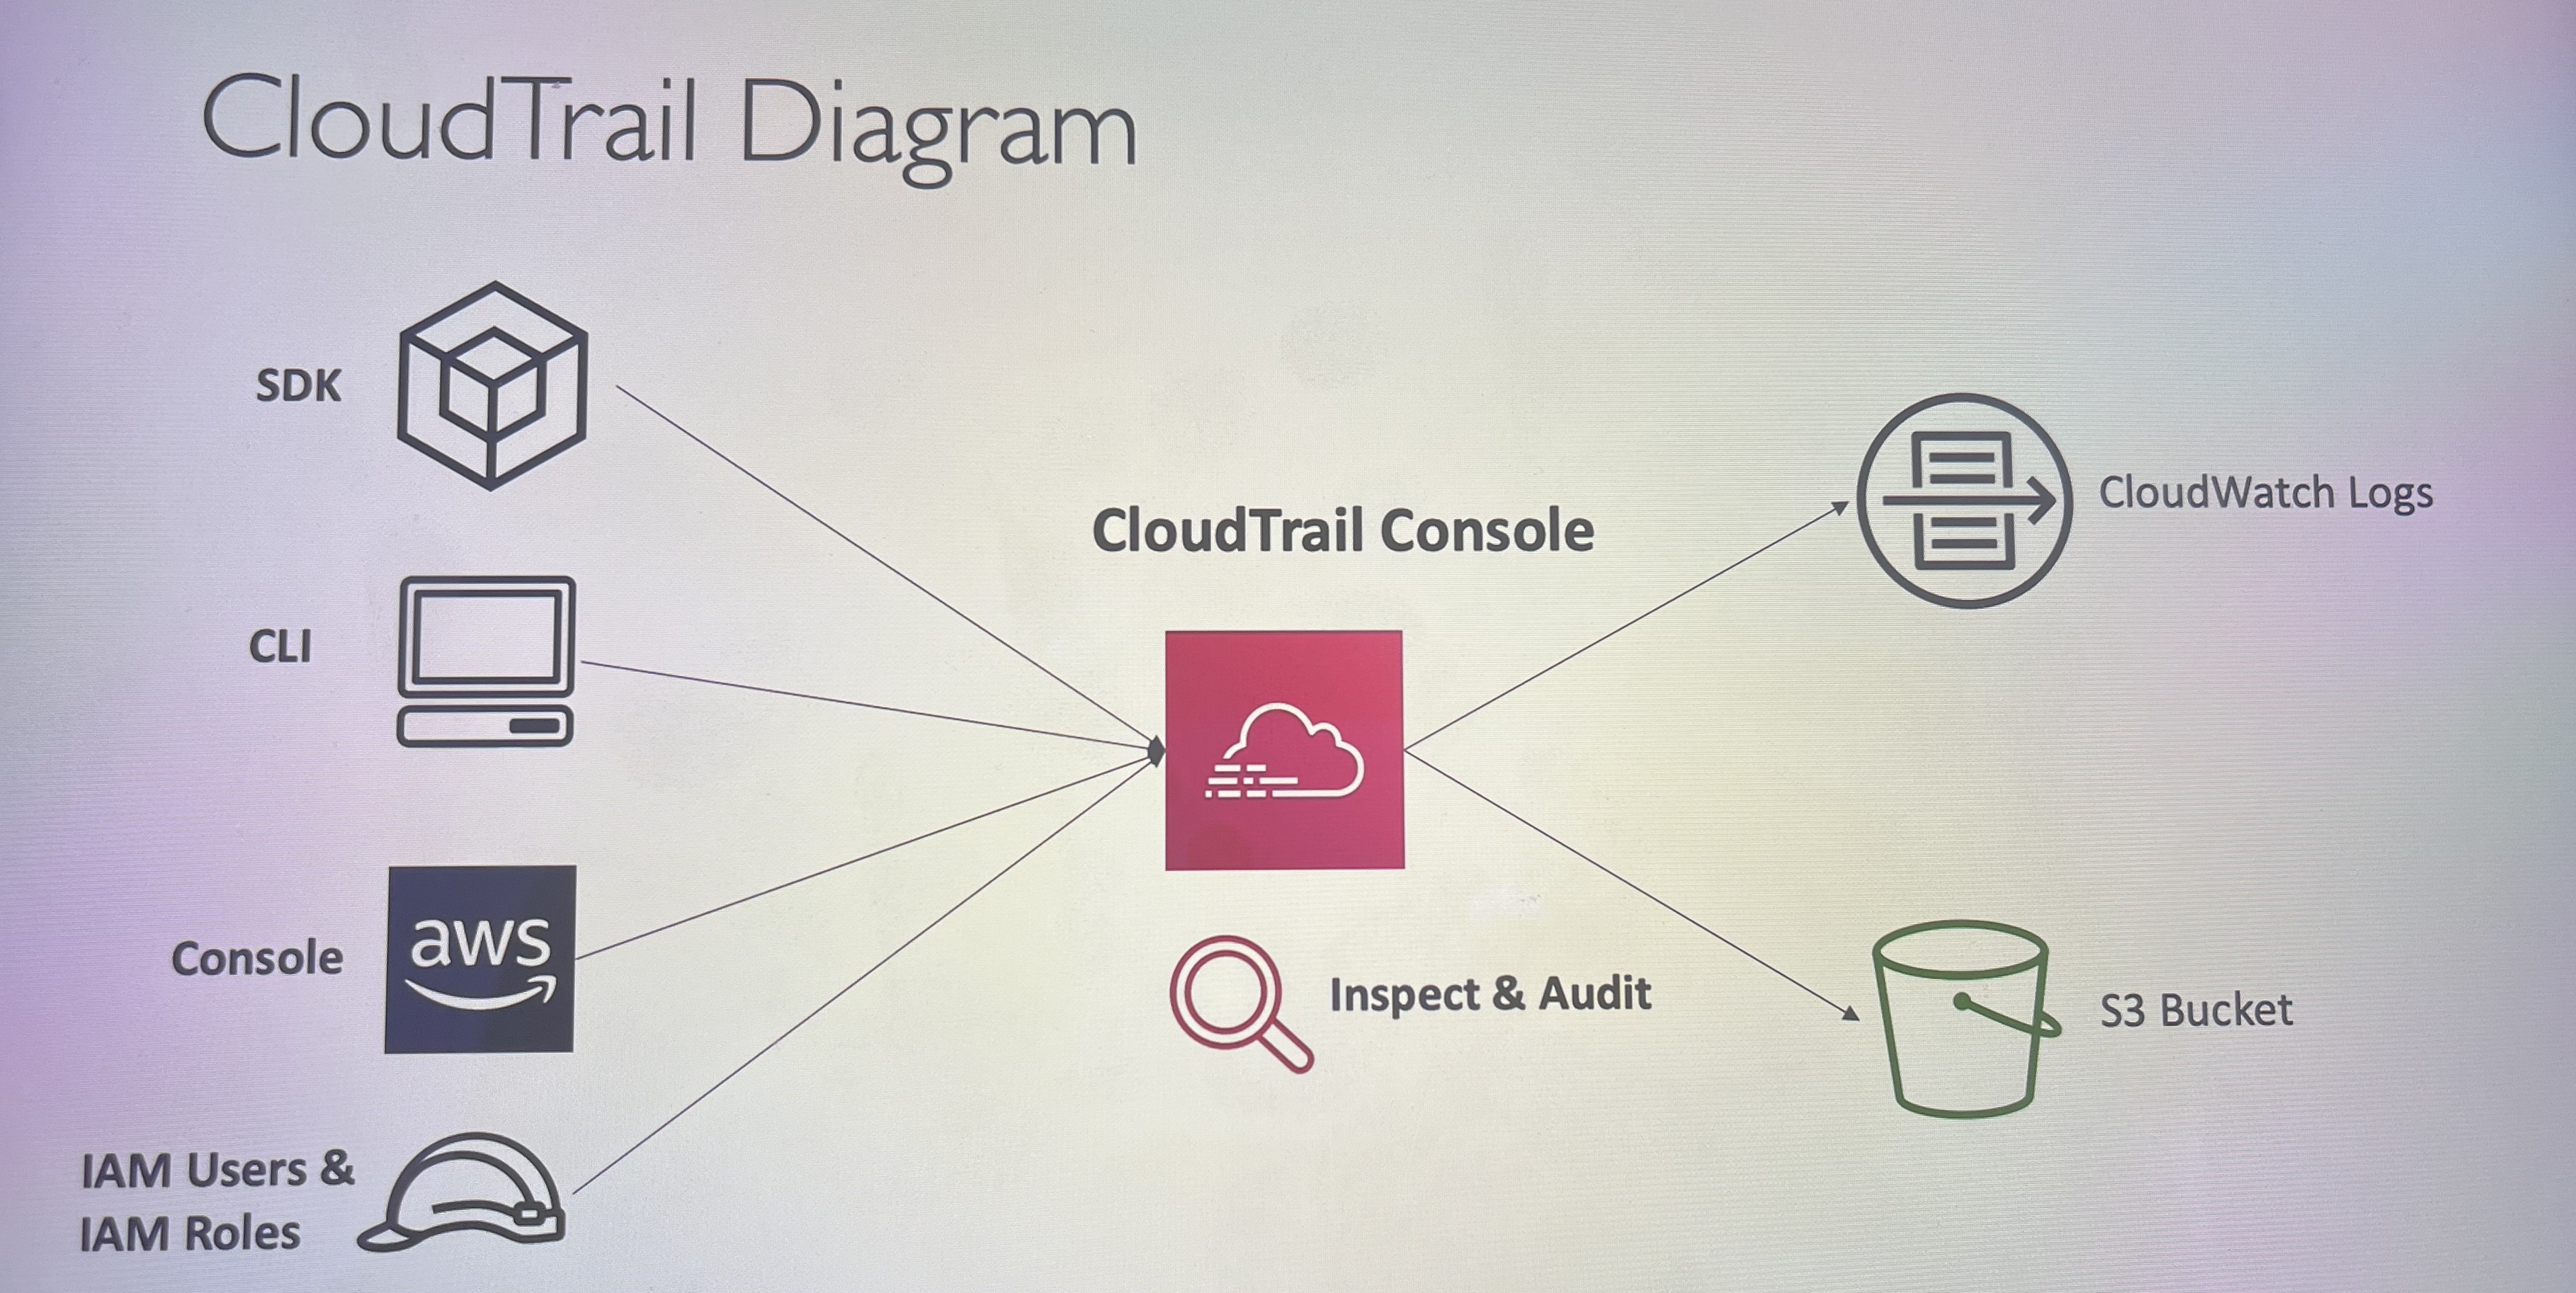
AWS X-Ray
In traditional debugging scenarios, the good way:
- Test locally
- Add log statements everywhere
- Re-deploy in production
Logs formats differ across applications & log analysis is hard
Debugging: one big monolith “easy”, distributed / decoupled services “hard”
No common views of your entire architecture.
To solve the problem of tracing what’s really happening underneath the scene in a distributed system / application, you can use AWS X-Ray.
So, with X-Ray, you are going to be able to do a tracing and get visual analysis of your application.
So, X-Ray once enabled on your services, then you will get a full picture of what’s happening for each of the service and see where they are failing, their performance, and in case one request goes wrong., you will be able to visualize itdirectly into the X-Ray console.
So the X-Ray advantages:
- Troubleshooting performance (bottleneck)
- understand dependencies in a microservice architecture. (Thanks to the connection between services and the visualization shown in below illustration)
- Pinpoint service issues
- Review request behavior
- Find errors and exceptions
- Are we meeting time SLA ?
- Where we are throttled ?
- Identify users that are impacted
Amazon CodeGuru
This is a machine learning powered service that will do two things: code reviews & code performance recommendations.
When developers push our codes, there is usually another developer that does a code review and then when the code is deployed into production, you need to be able to monitor the performance of your code and maybe you will detect bugs by looking at the performance.
So codeGuru does that in an automated fashion.
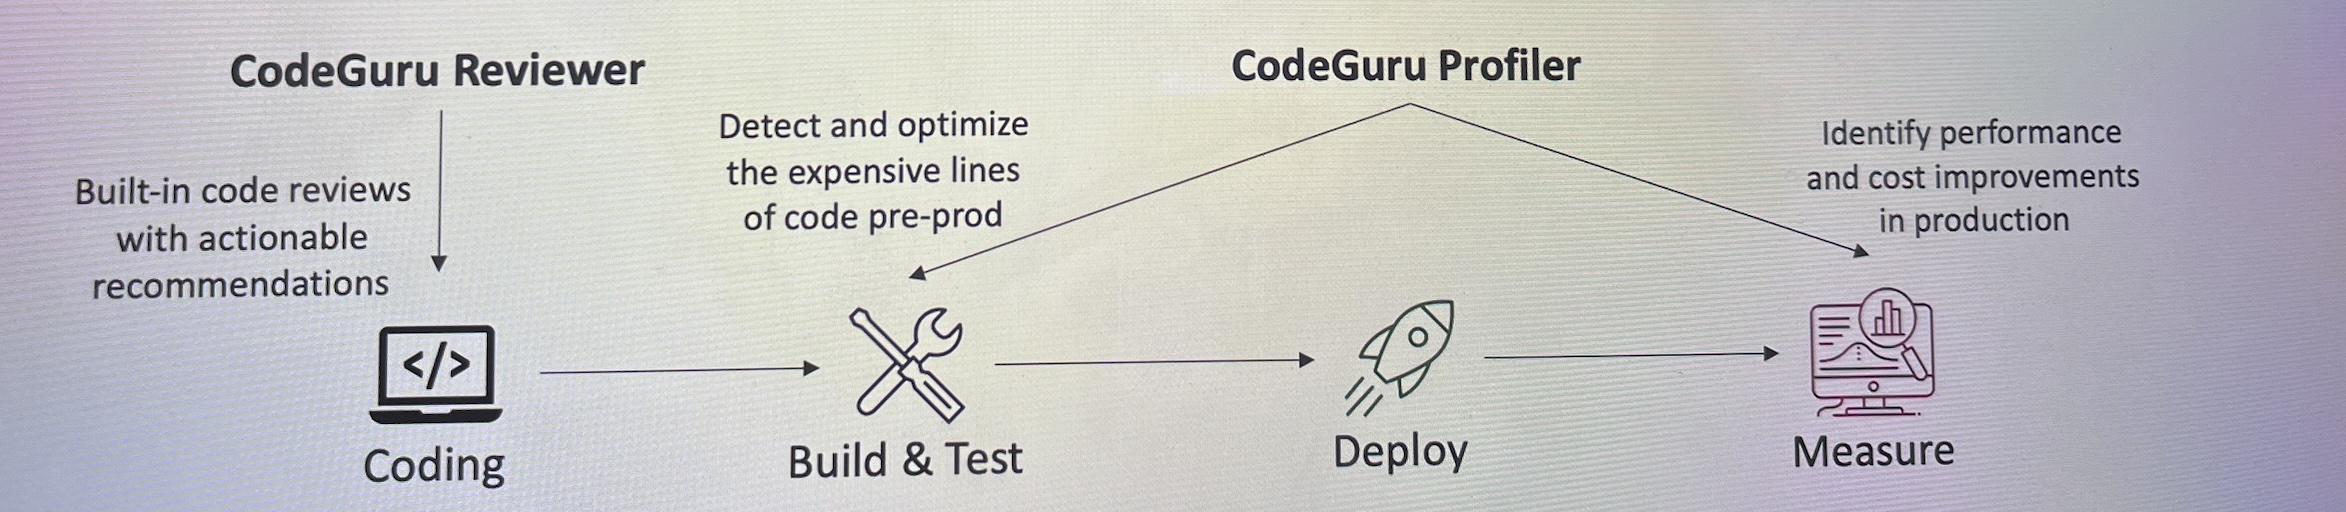
Provides two functionalities
- CodeGuru Reviewer: automated code reviews for static code analysis (development)
- critical issues
- security vulnerabilities
- hard-to-find bugs
- Common Coding best practices
- resource leaks
- security detection
- inputs validation
- Use Machine Learning & automated reasoning
- Lessons learnt from massive open source & other Amazon repositories
- Supports Java & Python
- Integrates with GitHub, Bitbucket, and AWS CodeCommit
- CodeGuru Profiler: visibility/recommendations about the application performance during runtime.(production)
- Helps Understand the runtime behavior of your application
- Example: identify if your application is consuming excessive CPU capacity on a logging routine.
- Features:
- Identify and remove code inefficiencies
- Improve application performance (e.g. reduce memory usage & CPU utilization)
- Decrease computational costs
- provides heap summary(identify which objects are using up memory)
- Anomaly detection
- Support application running on AWS or on-premises
- Minimal overhead on application
AWS Health Dashboard
There are two main parts under health dashboard, which namely are:
- Service History
- Your Account
AWS Health Dashboard - Service History
AWS Health Dashboard - Your Account
- Previously called AWS Personal Health Dashboard(PHD)
- AWS Account Health Dashboard provides alerts and remediation guidance when AWS is experiencing events that may impact you.
- While the Service Health Dashboard displays the general status of AWS services, Account Health Dashboard gives you the
personalized view into the performance and availabilityof the AWS services underlying your AWS resources. - The dashboard displays relevant and timely information to help you manage events in the progress and provides proactive notification to help you plan for scheduled activities.
- Can aggregate data from an entire AWS Organization.
You can get access to it by clicking the ringtone icon on the right-hand side of the navigation bar. Then you will notice that this is a global service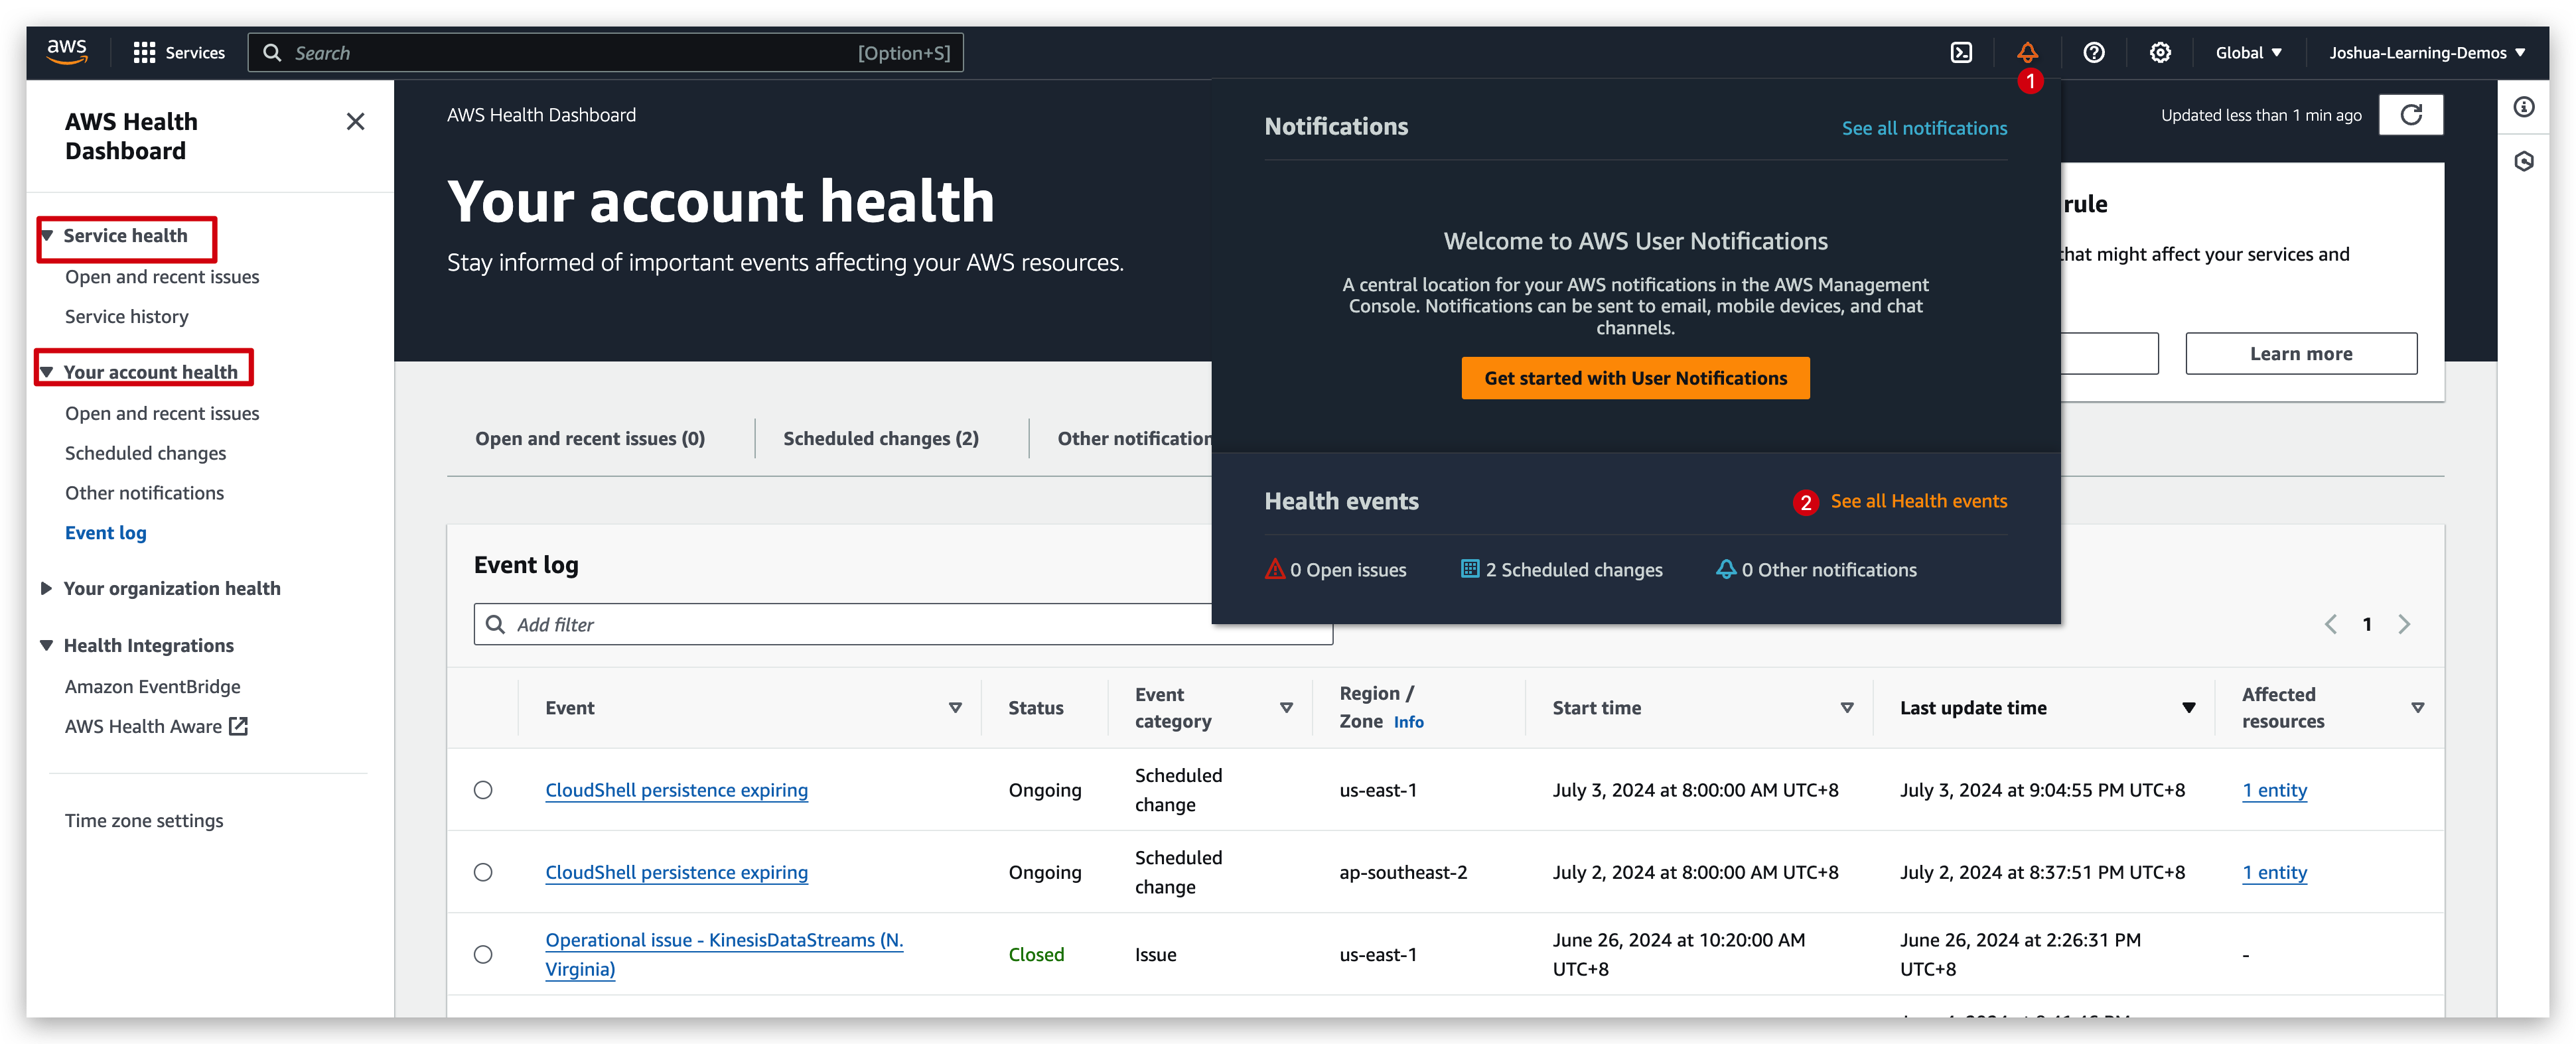
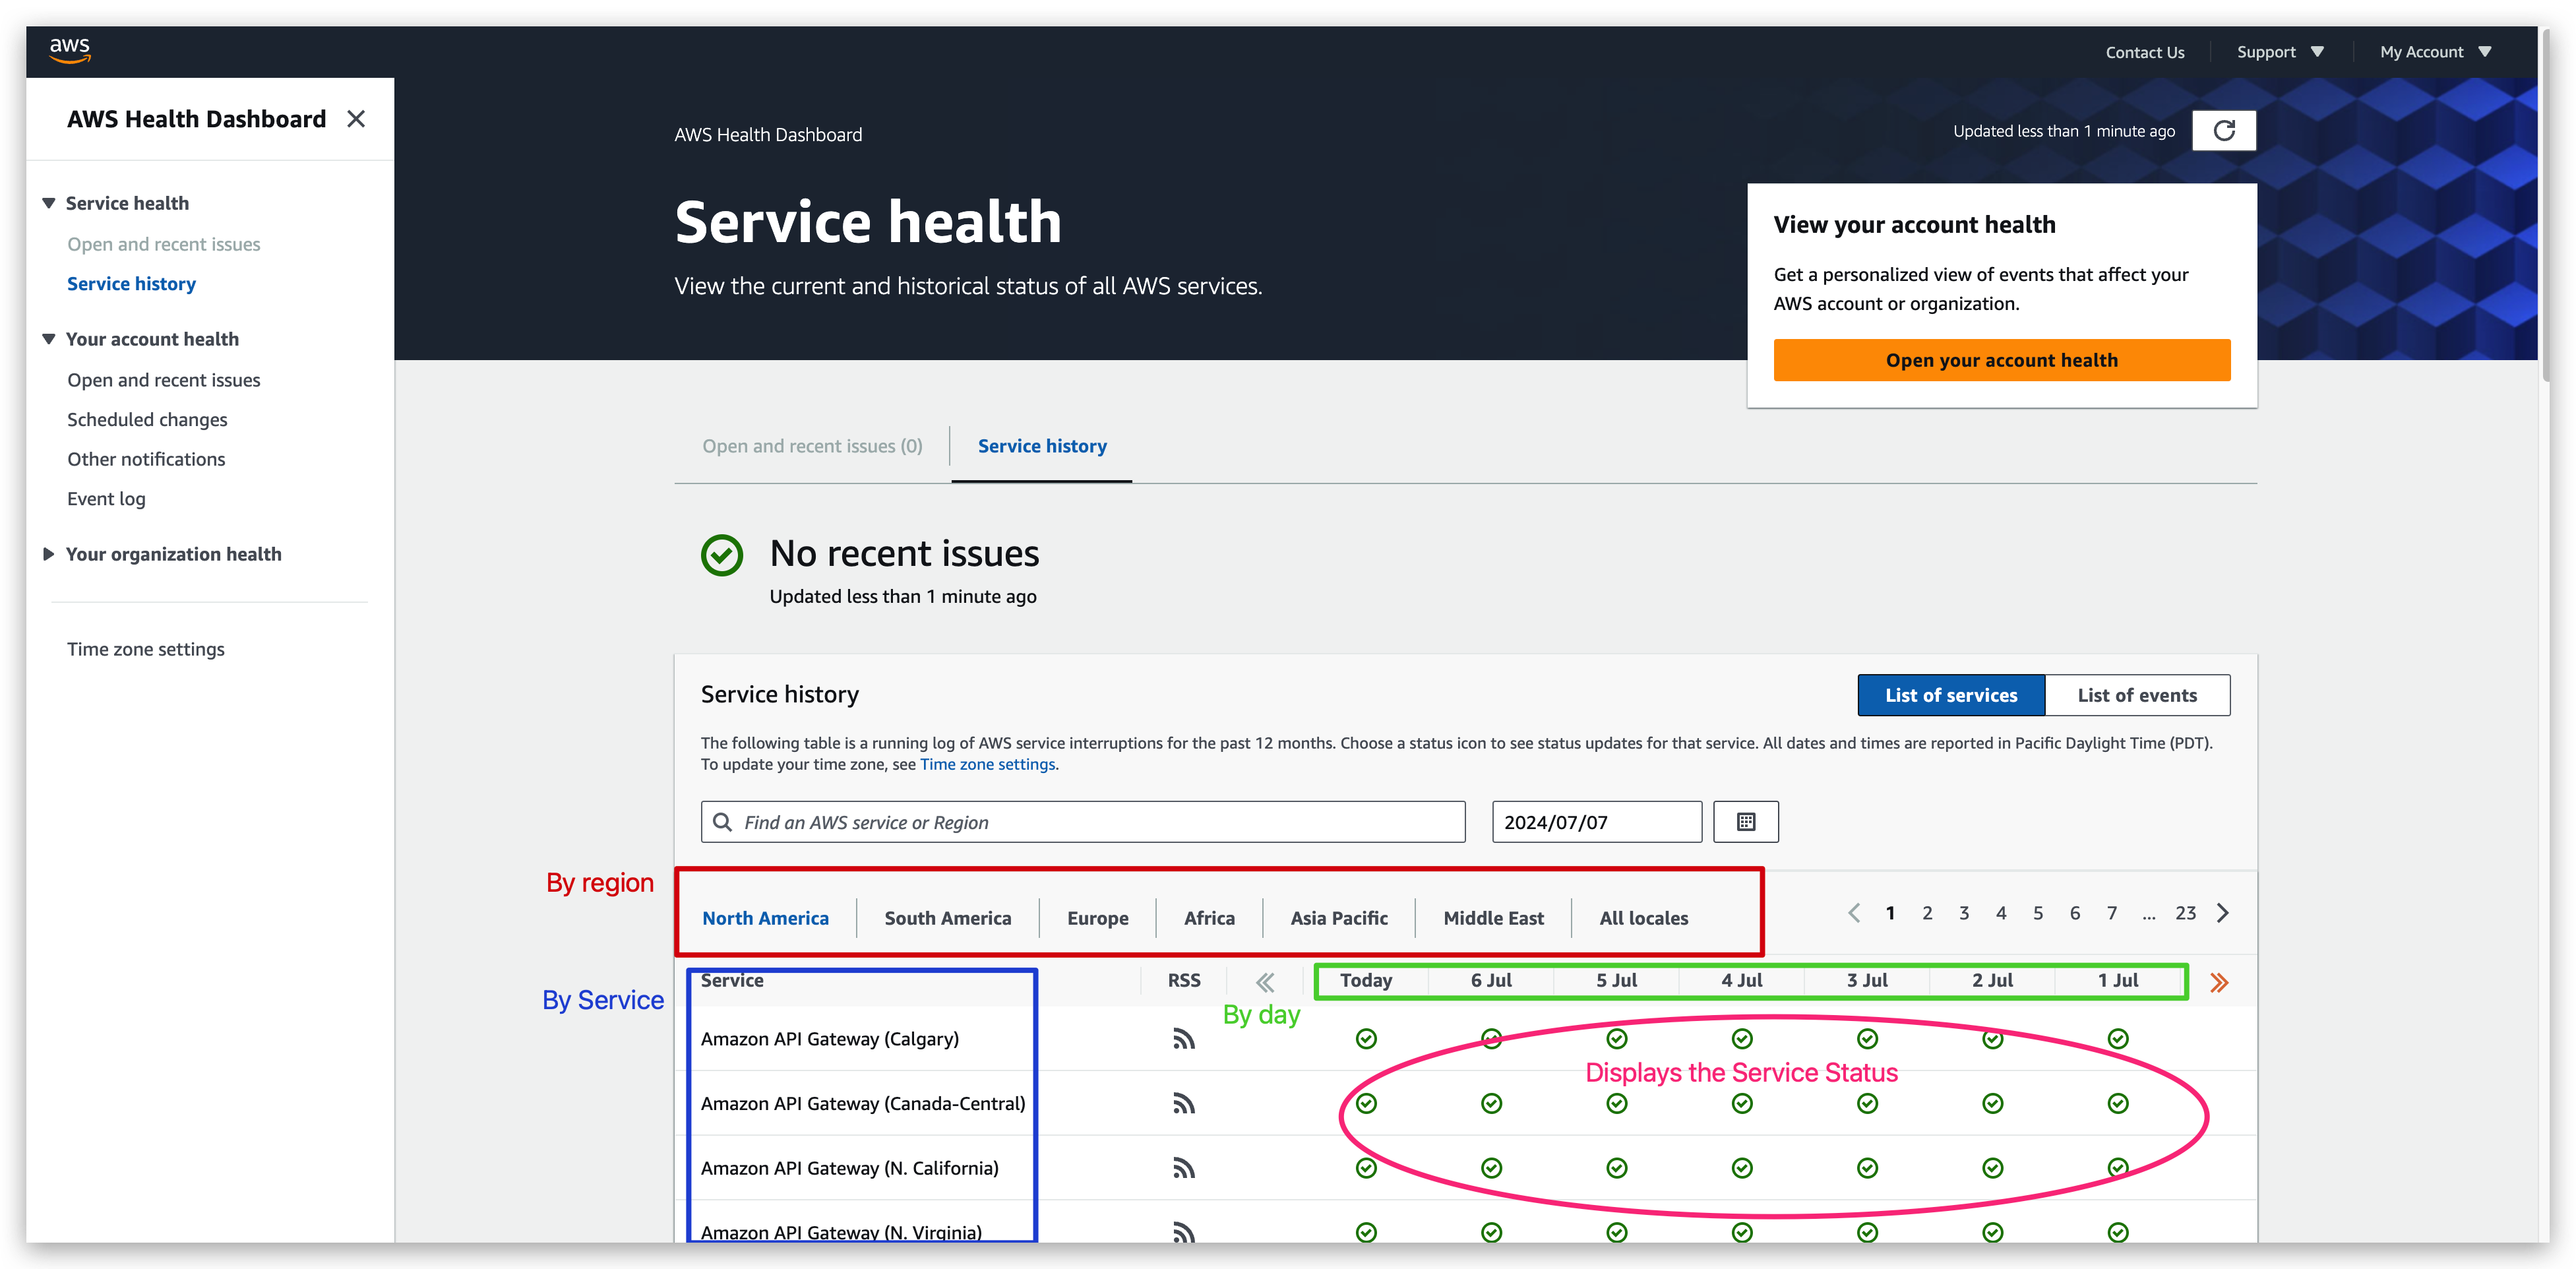
What’s shown in Service health dashboard is general and whole AWS-wide services while the information provided in account health dashboard is detailed and relative to the current account only.
Summary
Monitoring Summary
- CloudWatch:
- Metrics: monitor the performance of AWS services and billing metrics
- Alarms: automate notification, perform EC2 action, notify to SNS based on metric
- Logs: collect log files from EC2 instances, servers, Lambda functions…
- Events (or EventBridge): react to events in AWS, or trigger a rule on a schedule
- CloudTrail: audit API calls made within your AWS account
- CloudTrail Insights: automated analysis of your CloudTrail Events
- X-Ray: trace requests made through your distributed applications
- AWS Health Dashboard: status of all AWS services across all regions
- AWS Account Health Dashboard: AWS events that impact your infrastructure
- Amazon CodeGuru: automated code reviews and application performance recommendations
Quiz